Description
🏦 Venture Fund Performance Dashboard 🔢
🪟 Theme: Royal Capital · Power BI
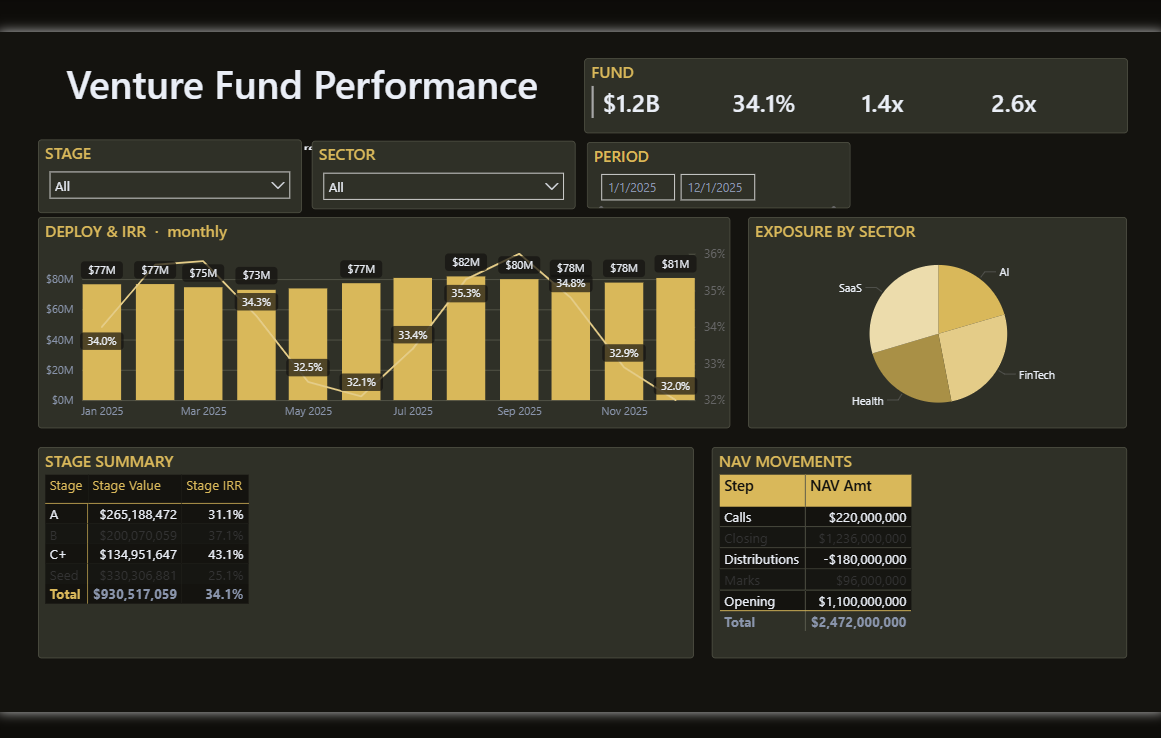
The Venture Fund Performance dashboard turns day-to-day banking & finance data into a clear, decision-ready view. Built on a sleek, dark Power BI canvas, it brings the metrics that matter — As Of, Fund Assets under Management, Total Invested, Distributions Year-to-Date, Deployed Year-to-Date and Latest Net Asset Value — together on a single interactive page so trends, outliers and progress against target are obvious at a glance.
🧩 Key Features:
✅ As Of
✅ Fund Assets under Management
✅ Total Invested
✅ Distributions Year-to-Date
✅ Deployed Year-to-Date
✅ Latest Net Asset Value
✅ Month-over-Month Net Asset Value Change
✅ Headline KPI cards
✅ Interactive slicers & filters


