Description
🧭 Accounting Firm Performance Dashboard 🧠
🧵 Theme: Slate Porcelain · Power BI
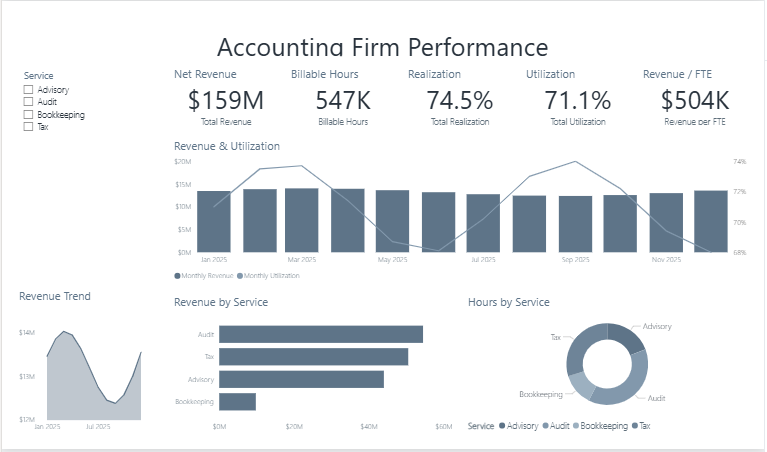
The Accounting Firm Performance dashboard turns day-to-day professional services data into a clear, decision-ready view. Built on a clean, light Power BI canvas, it brings the metrics that matter — Total Revenue, Billable Hours, Total Realization, Total Utilization, Revenue per Full-Time Employee and Monthly Revenue — together on a single interactive page so trends, outliers and progress against target are obvious at a glance.
📌 Key Features:
✅ Total Revenue
✅ Billable Hours
✅ Total Realization
✅ Total Utilization
✅ Revenue per Full-Time Employee
✅ Monthly Revenue
✅ Monthly Utilization
✅ Headline KPI cards
✅ Interactive slicers & filters