Description
🌱 Agriculture & Yield Performance Dashboard 📊📈
🪞 Theme: Terra Sienna · Power BI
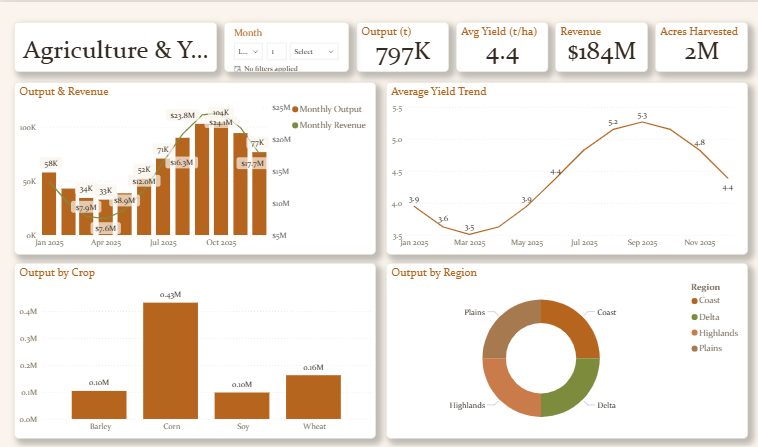
The Agriculture & Yield Performance dashboard turns day-to-day agriculture & farming data into a clear, decision-ready view. Built on a clean, light Power BI canvas, it brings the metrics that matter — Total Output, Average Yield, Total Revenue, Total Acres, Monthly Output and Monthly Revenue — together on a single interactive page so trends, outliers and progress against target are obvious at a glance.
🧱 Key Features:
✅ Total Output
✅ Average Yield
✅ Total Revenue
✅ Total Acres
✅ Monthly Output
✅ Monthly Revenue
✅ Monthly Yield
✅ Headline KPI cards
✅ Interactive slicers & filters