Description
💻 Data Centre Cooling Dashboard 📡
🖌️ Theme: Slate Aurora · Power BI
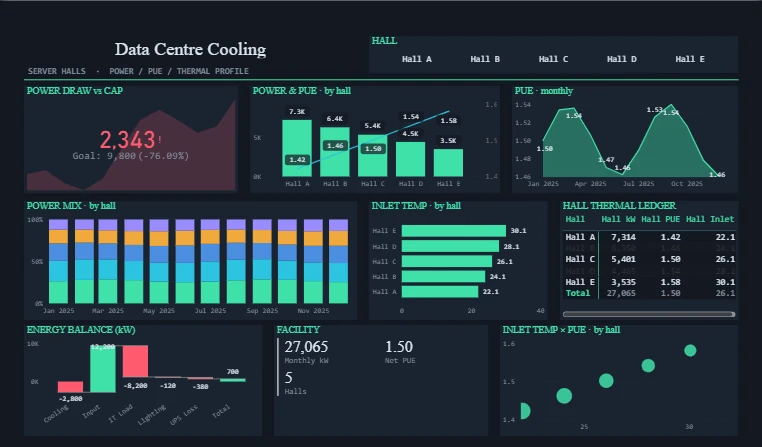
The Data Centre Cooling dashboard turns day-to-day technology & saas data into a clear, decision-ready view. Built on a sleek, dark Power BI canvas, it brings the metrics that matter — Monthly Kilowatts, Kilowatts Target, Hall Kilowatts, Hall Power Usage Effectiveness, Hall Inlet and Cooling — together on a single interactive page so trends, outliers and progress against target are obvious at a glance.
🚀 Key Features:
✅ Monthly Kilowatts
✅ Kilowatts Target
✅ Hall Kilowatts
✅ Hall Power Usage Effectiveness
✅ Hall Inlet
✅ Cooling
✅ Cooling Target
✅ Headline KPI cards
✅ Interactive slicers & filters