Description
🌱 Forestry Management Dashboard 📂
🎚️ Theme: Forest Moss · Power BI
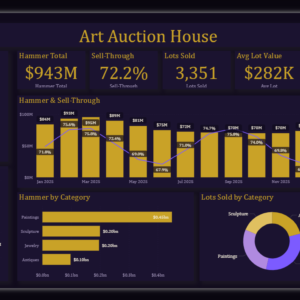
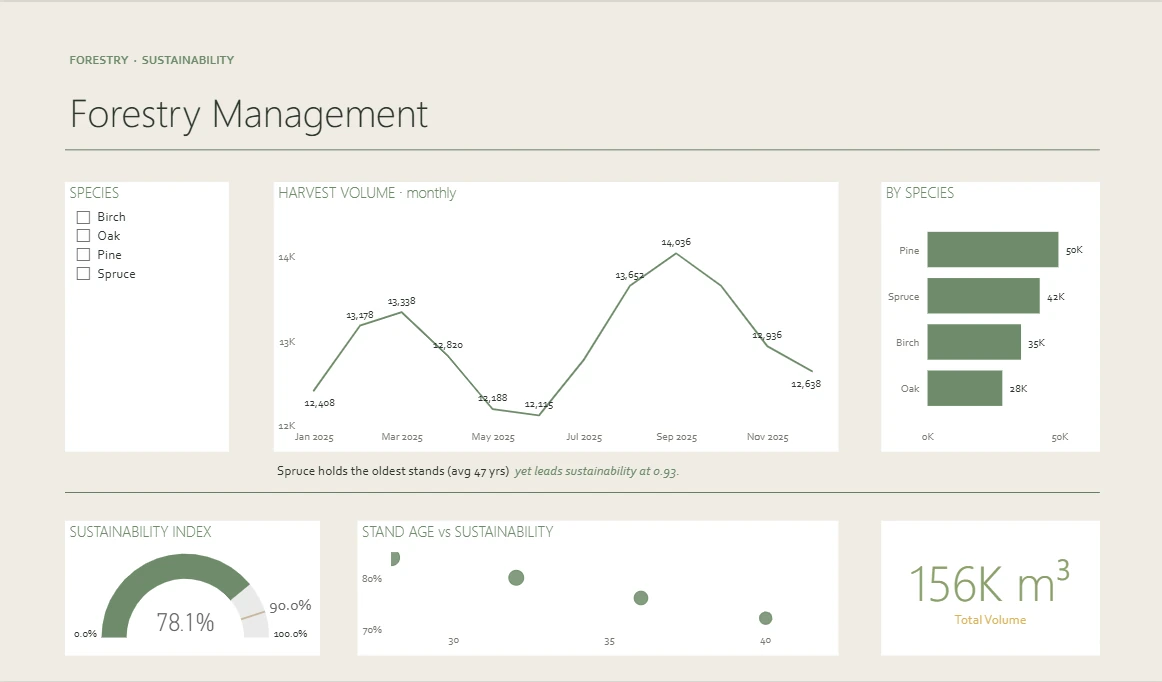
The Forestry Management dashboard turns day-to-day agriculture & farming data into a clear, decision-ready view. Built on a sleek, dark Power BI canvas, it brings the metrics that matter — Total Volume, Monthly Volume, Species Volume, Species Age, Sustainability and Sust Target — together on a single interactive page so trends, outliers and progress against target are obvious at a glance.
🎯 Key Features:
✅ Total Volume
✅ Monthly Volume
✅ Species Volume
✅ Species Age
✅ Sustainability
✅ Sust Target
✅ Scatter / correlation plot
✅ Ranked horizontal breakdown
✅ Interactive slicers & filters