Description
🧬 Pharma R&D Pipeline Dashboard 🧠
🧵 Theme: Obsidian Jade · Power BI
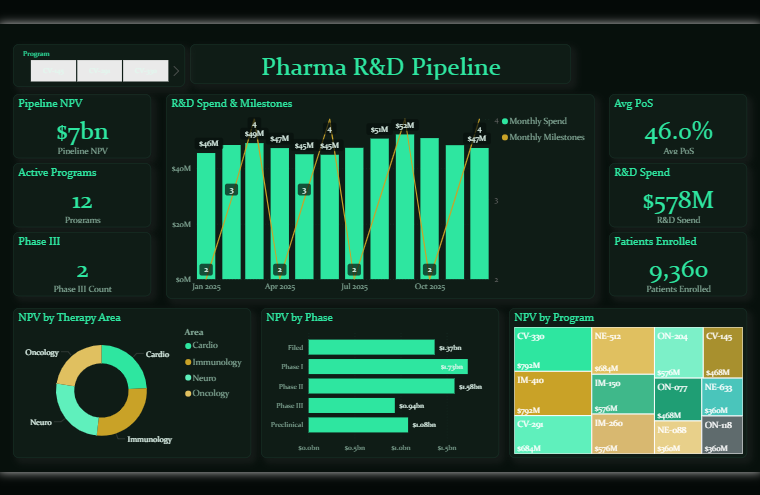
The Pharma R&D Pipeline dashboard turns day-to-day pharma & life sciences data into a clear, decision-ready view. Built on a sleek, dark Power BI canvas, it brings the metrics that matter — Pipeline Net Present Value, Programs, Phase III Count, Average Probability of Success, Patients Enrolled and R&District Spend — together on a single interactive page so trends, outliers and progress against target are obvious at a glance.
🛠️ Key Features:
✅ Pipeline Net Present Value
✅ Programs
✅ Phase III Count
✅ Average Probability of Success
✅ Patients Enrolled
✅ R&District Spend
✅ Program Net Present Value
✅ Headline KPI cards
✅ Interactive slicers & filters