Description
✈️ Ride-Hailing Marketplace Dashboard 🔢
🪟 Theme: Onyx Lattice · Power BI
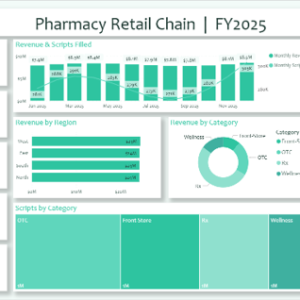
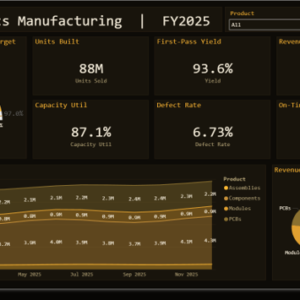
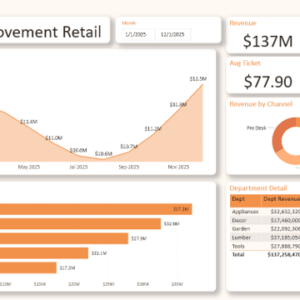
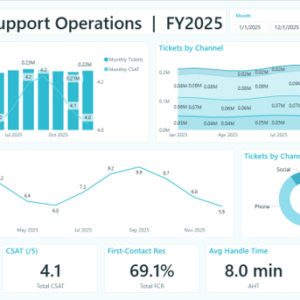
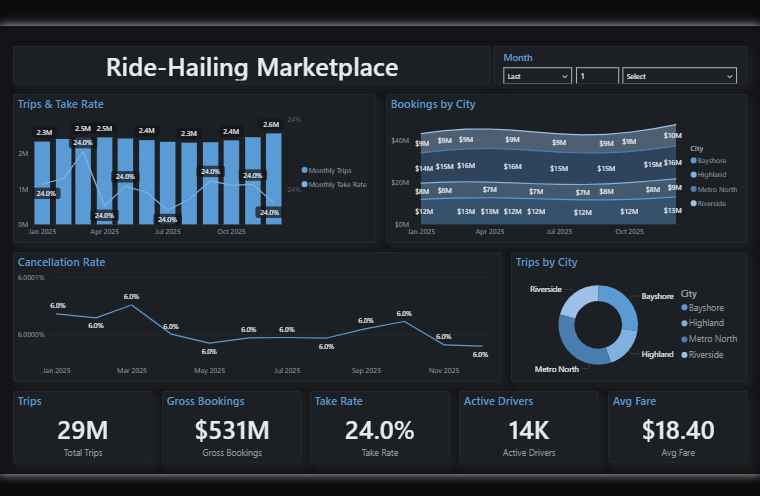
The Ride-Hailing Marketplace dashboard turns day-to-day transport & mobility data into a clear, decision-ready view. Built on a sleek, dark Power BI canvas, it brings the metrics that matter — Total Trips, Gross Bookings, Net Revenue, Take Rate, Active Drivers and Average Fare — together on a single interactive page so trends, outliers and progress against target are obvious at a glance.
📋 Key Features:
✅ Total Trips
✅ Gross Bookings
✅ Net Revenue
✅ Take Rate
✅ Active Drivers
✅ Average Fare
✅ Monthly Trips
✅ Headline KPI cards
✅ Interactive slicers & filters