Description
🌱 Aquaculture Production Dashboard 📡
🎚️ Theme: Nebra Teal · Power BI
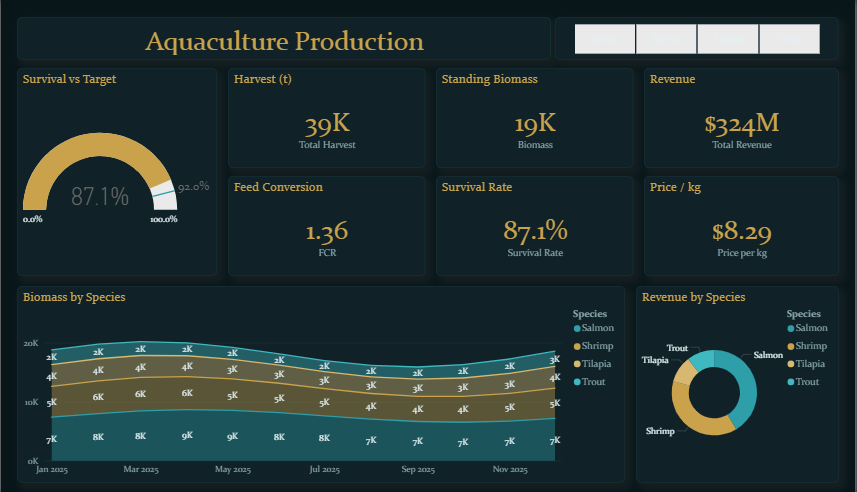
The Aquaculture Production dashboard turns day-to-day agriculture & farming data into a clear, decision-ready view. Built on a sleek, dark Power BI canvas, it brings the metrics that matter — Total Harvest, Biomass, Total Revenue, First-Call Resolution, Survival Rate and Survival Target — together on a single interactive page so trends, outliers and progress against target are obvious at a glance.
🎯 Key Features:
✅ Total Harvest
✅ Biomass
✅ Total Revenue
✅ First-Call Resolution
✅ Survival Rate
✅ Survival Target
✅ Price per kg
✅ Headline KPI cards
✅ Interactive slicers & filters


