Description
🛍️ Subscription Box Commerce Dashboard 🗄️
🧪 Theme: Nocturne Rose · Power BI
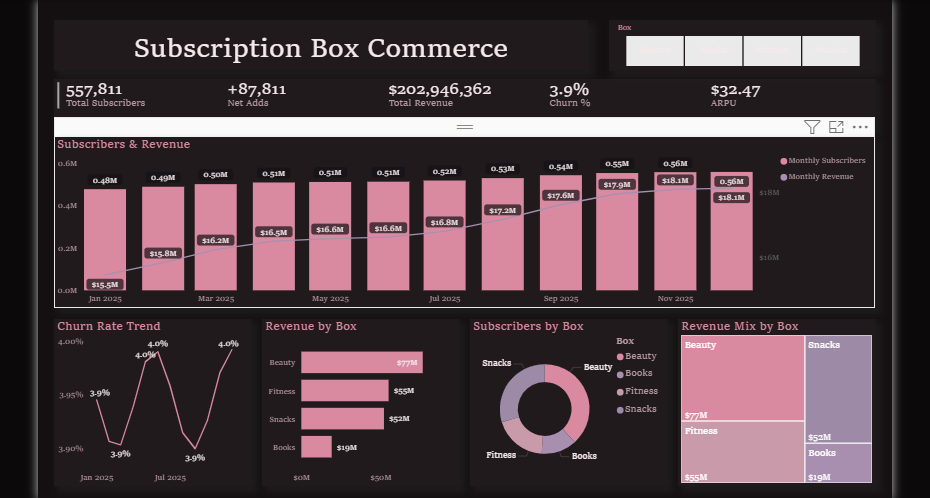
The Subscription Box Commerce dashboard turns day-to-day retail & consumer data into a clear, decision-ready view. Built on a sleek, dark Power BI canvas, it brings the metrics that matter — Total Subscribers, Net Adds, Total Revenue, Churn %, Revenue per User and Monthly Subscribers — together on a single interactive page so trends, outliers and progress against target are obvious at a glance.
⭐ Key Features:
✅ Total Subscribers
✅ Net Adds
✅ Total Revenue
✅ Churn %
✅ Revenue per User
✅ Monthly Subscribers
✅ Monthly Revenue
✅ Headline KPI cards
✅ Interactive slicers & filters


