Description
🛍️ Coffee & Cafe Chain Dashboard 🖼️
🪟 Theme: Saffron Meridian · Power BI
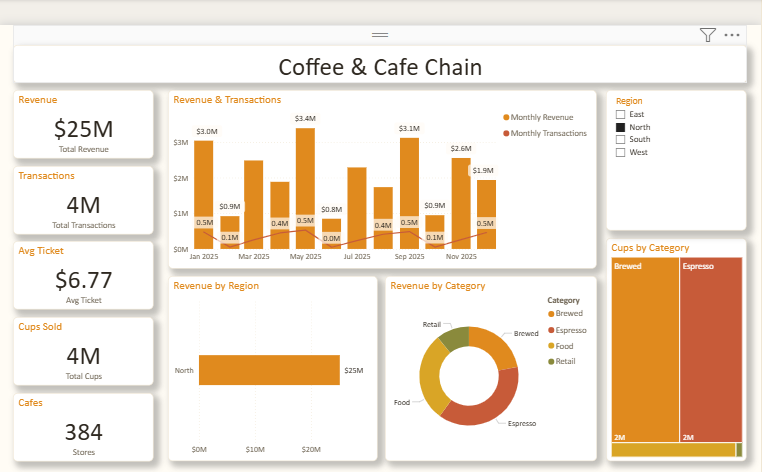
The Coffee & Cafe Chain dashboard turns day-to-day retail & consumer data into a clear, decision-ready view. Built on a clean, light Power BI canvas, it brings the metrics that matter — Total Revenue, Total Transactions, Average Ticket, Total Cups, Stores and Monthly Revenue — together on a single interactive page so trends, outliers and progress against target are obvious at a glance.
🧩 Key Features:
✅ Total Revenue
✅ Total Transactions
✅ Average Ticket
✅ Total Cups
✅ Stores
✅ Monthly Revenue
✅ Monthly Transactions
✅ Headline KPI cards
✅ Interactive slicers & filters


