Description
🏥 Dental Group Performance Dashboard 📊📈
🌈 Theme: Mint Porcelain · Power BI
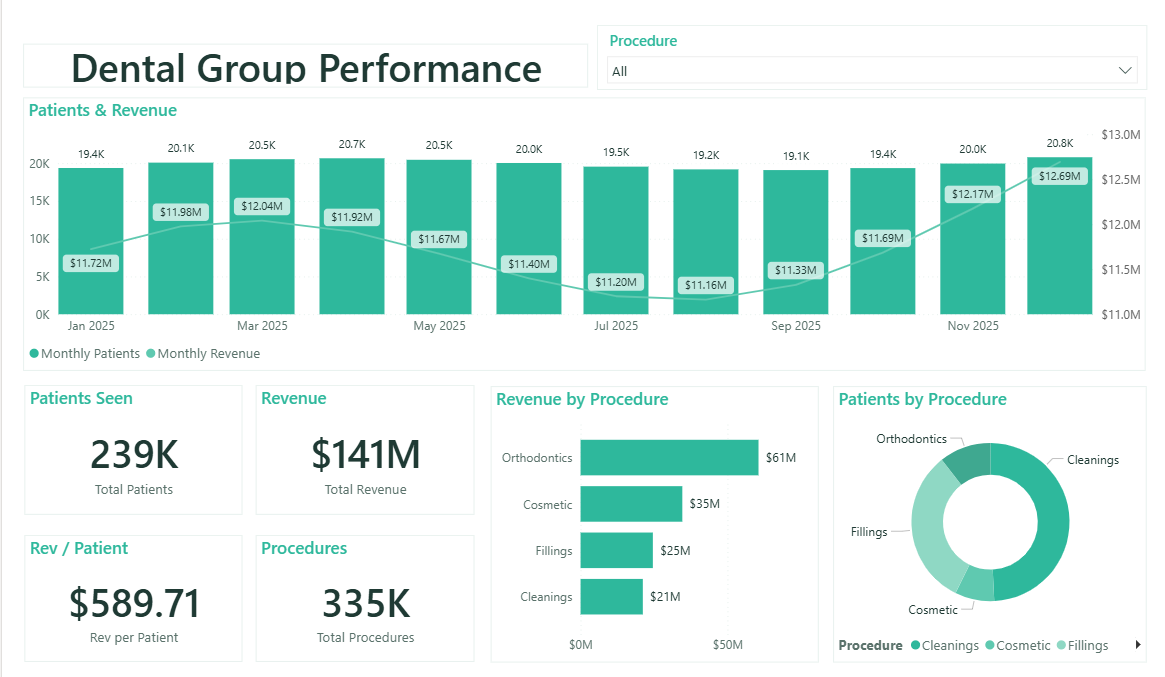
The Dental Group Performance dashboard turns day-to-day healthcare data into a clear, decision-ready view. Built on a clean, light Power BI canvas, it brings the metrics that matter — Total Patients, Total Revenue, Revenue per Patient, Total Procedures, Monthly Patients and Monthly Revenue — together on a single interactive page so trends, outliers and progress against target are obvious at a glance.
🔆 Key Features:
✅ Total Patients
✅ Total Revenue
✅ Revenue per Patient
✅ Total Procedures
✅ Monthly Patients
✅ Monthly Revenue
✅ Proc Revenue
✅ Headline KPI cards
✅ Interactive slicers & filters


