Description
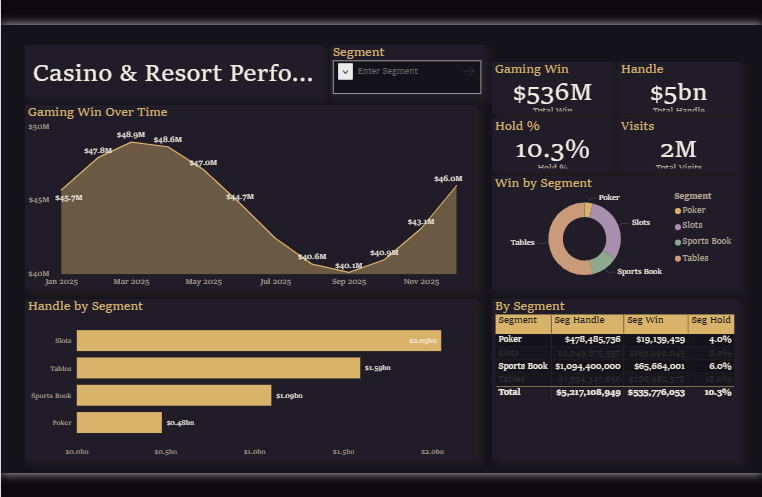
🛍️ Casino & Resort Performance Dashboard 🖥️
🎨 Theme: Vesper Glow · Power BI
The Casino & Resort Performance dashboard turns day-to-day retail & consumer data into a clear, decision-ready view. Built on a sleek, dark Power BI canvas, it brings the metrics that matter — Total Win, Total Handle, Hold %, Total Visits, Hotel Revenue and Monthly Win — together on a single interactive page so trends, outliers and progress against target are obvious at a glance.
📐 Key Features:
✅ Total Win
✅ Total Handle
✅ Hold %
✅ Total Visits
✅ Hotel Revenue
✅ Monthly Win
✅ Segment Win
✅ Headline KPI cards
✅ Cumulative area trends