Description
⚡ EV Charging Network Dashboard 🧮
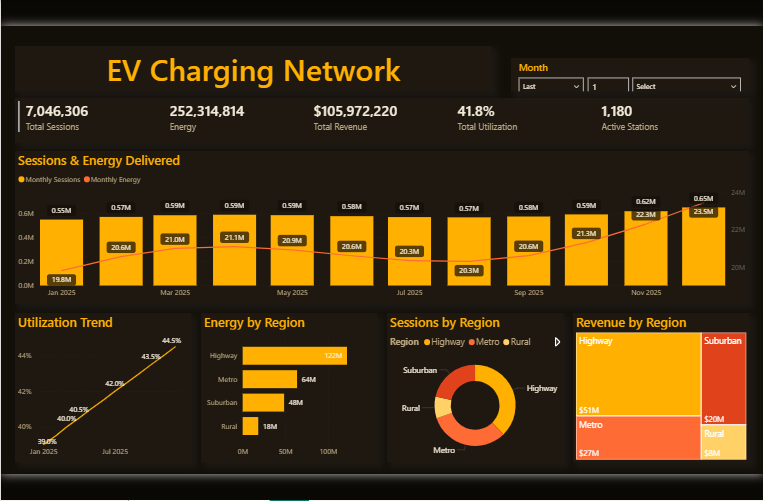
🪄 Theme: Solar Flare Dark · Power BI
The EV Charging Network dashboard turns day-to-day energy & utilities data into a clear, decision-ready view. Built on a sleek, dark Power BI canvas, it brings the metrics that matter — Total Sessions, Energy, Total Revenue, Total Utilization, Active Stations and Monthly Sessions — together on a single interactive page so trends, outliers and progress against target are obvious at a glance.
🎛️ Key Features:
✅ Total Sessions
✅ Energy
✅ Total Revenue
✅ Total Utilization
✅ Active Stations
✅ Monthly Sessions
✅ Monthly Energy
✅ Headline KPI cards
✅ Interactive slicers & filters


