Description
💧 Water Utility Operations Dashboard 📈
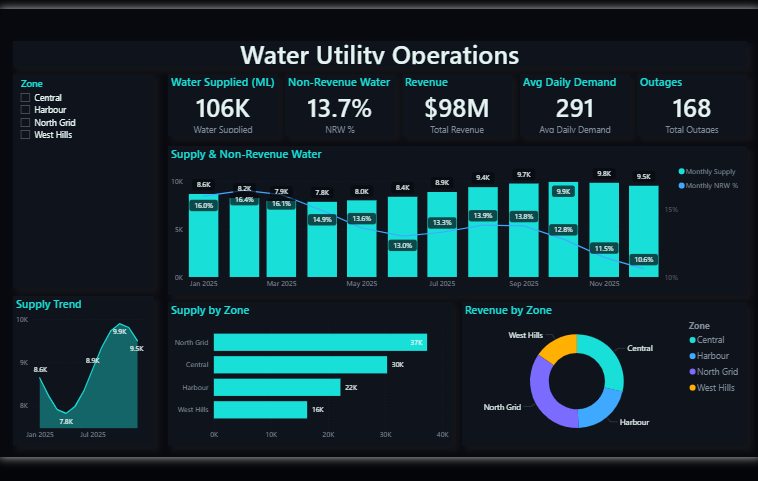
🎭 Theme: Voidwave Carbon · Power BI
The Water Utility Operations dashboard turns day-to-day utilities data into a clear, decision-ready view. Built on a sleek, dark Power BI canvas, it brings the metrics that matter — Water Supplied, Non-Revenue Water %, Total Revenue, Total Outages, Average Daily Demand and Monthly Supply — together on a single interactive page so trends, outliers and progress against target are obvious at a glance.
🔑 Key Features:
✅ Water Supplied
✅ Non-Revenue Water %
✅ Total Revenue
✅ Total Outages
✅ Average Daily Demand
✅ Monthly Supply
✅ Monthly Non-Revenue Water %
✅ Headline KPI cards
✅ Interactive slicers & filters


