Description
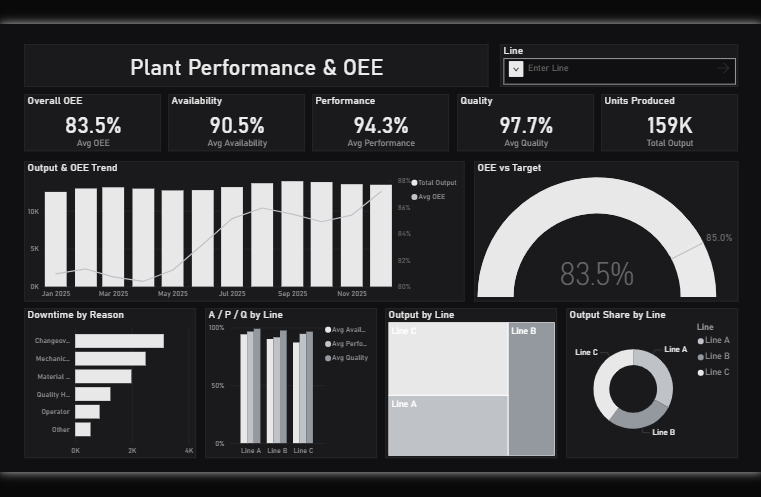
🏭 Plant Performance & OEE Dashboard 📊
🧵 Theme: Basalt Mono · Power BI
The Plant Performance & OEE dashboard turns day-to-day manufacturing & industrial data into a clear, decision-ready view. Built on a sleek, dark Power BI canvas, it brings the metrics that matter — Average Equipment Effectiveness, Average Availability, Average Performance, Average Quality, Total Output and Downtime Hrs — together on a single interactive page so trends, outliers and progress against target are obvious at a glance.
🛠️ Key Features:
✅ Average Equipment Effectiveness
✅ Average Availability
✅ Average Performance
✅ Average Quality
✅ Total Output
✅ Downtime Hrs
✅ Scrap %
✅ Headline KPI cards
✅ Combo trend & volume chart


