Description
🎬 Newsroom Analytics Dashboard 📈
🪟 Theme: Press Noir · Power BI
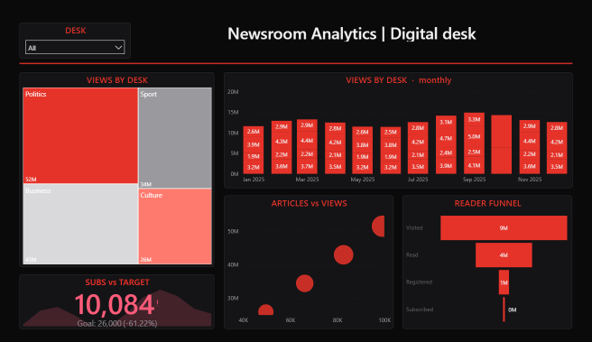
The Newsroom Analytics dashboard turns day-to-day media & entertainment data into a clear, decision-ready view. Built on a sleek, dark Power BI canvas, it brings the metrics that matter — Monthly Views, Desk Views, Desk Articles, Monthly Subscribers and Subscribers Target — together on a single interactive page so trends, outliers and progress against target are obvious at a glance.
📋 Key Features:
✅ Monthly Views
✅ Desk Views
✅ Desk Articles
✅ Monthly Subscribers
✅ Subscribers Target
✅ Headline KPI cards
✅ Interactive slicers & filters
✅ Period-over-period columns
✅ Conversion funnel


