Description
⚡ Airspace Control Dashboard 📡
🎚️ Theme: Drone Cyan · Power BI
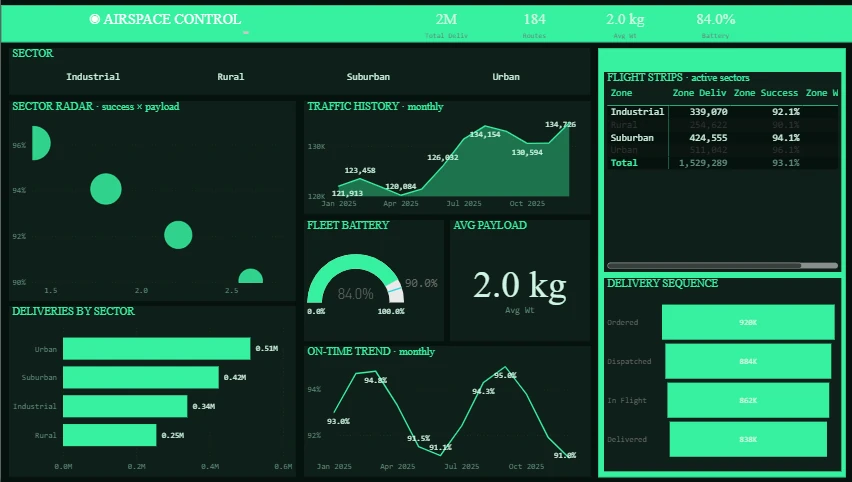
The Airspace Control dashboard turns day-to-day energy & utilities data into a clear, decision-ready view. Built on a sleek, dark Power BI canvas, it brings the metrics that matter — Total Deliv, Battery, Routes, Average Weight, Monthly Deliv and Zone Deliv — together on a single interactive page so trends, outliers and progress against target are obvious at a glance.
⚡ Key Features:
✅ Total Deliv
✅ Battery
✅ Routes
✅ Average Weight
✅ Monthly Deliv
✅ Zone Deliv
✅ Zone Success
✅ Headline KPI cards
✅ Goal-vs-actual gauge


