Description
🛍️ Airport Operations Dashboard 🛰️
🧪 Theme: Cerulean Clean · Power BI
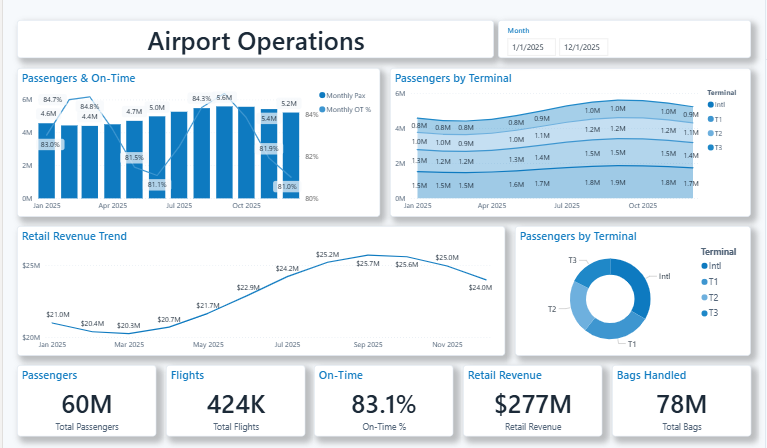
The Airport Operations dashboard turns day-to-day retail & consumer data into a clear, decision-ready view. Built on a clean, light Power BI canvas, it brings the metrics that matter — Total Passengers, Total Flights, On-Time %, Retail Revenue, Total Bags and Monthly Passengers — together on a single interactive page so trends, outliers and progress against target are obvious at a glance.
⭐ Key Features:
✅ Total Passengers
✅ Total Flights
✅ On-Time %
✅ Retail Revenue
✅ Total Bags
✅ Monthly Passengers
✅ Monthly OT %
✅ Headline KPI cards
✅ Interactive slicers & filters