Description
🎬 Aurora Festival 2025 Dashboard 📊📈
🪞 Theme: Festival Sage · Power BI
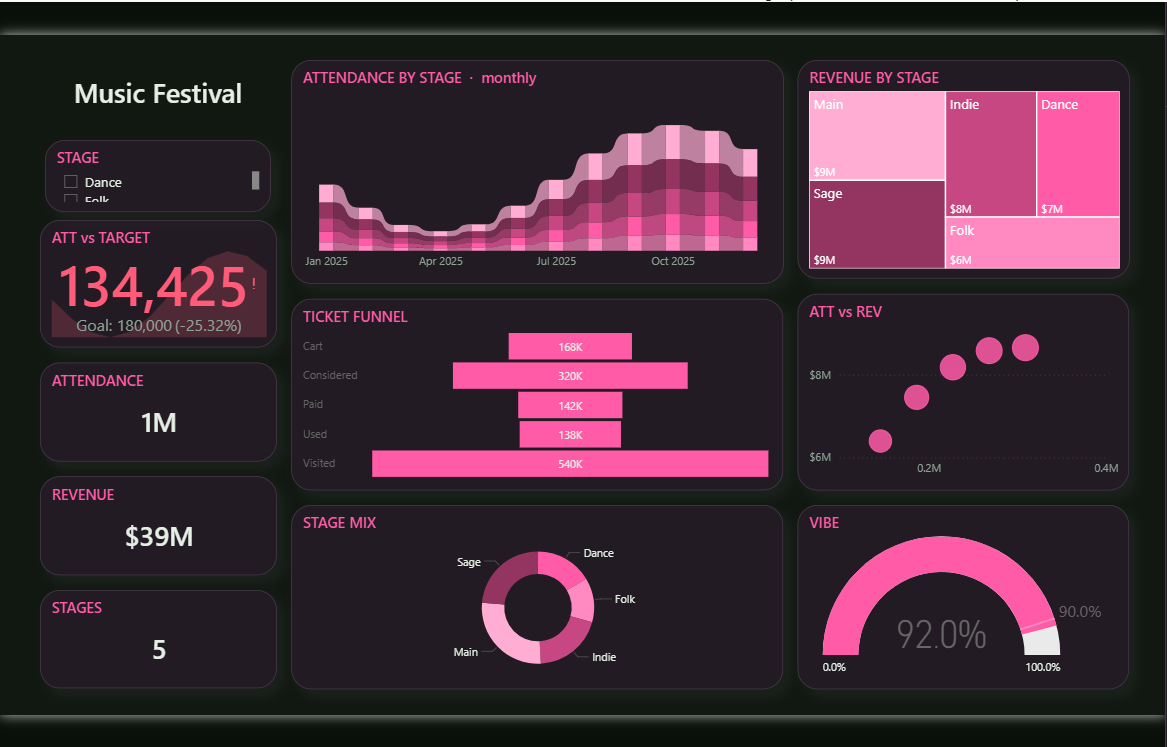
The Aurora Festival 2025 dashboard turns day-to-day media & entertainment data into a clear, decision-ready view. Built on a sleek, dark Power BI canvas, it brings the metrics that matter — Total Attendance, Total Revenue, Total Satisfaction, Stages, Monthly Attendance and Stage Attendance — together on a single interactive page so trends, outliers and progress against target are obvious at a glance.
🧱 Key Features:
✅ Total Attendance
✅ Total Revenue
✅ Total Satisfaction
✅ Stages
✅ Monthly Attendance
✅ Stage Attendance
✅ Stage Revenue
✅ Headline KPI cards
✅ Cumulative area trends


