Description
🏦 Brokerage Performance Dashboard 🧾
🪞 Theme: Atrium Saffron · Power BI
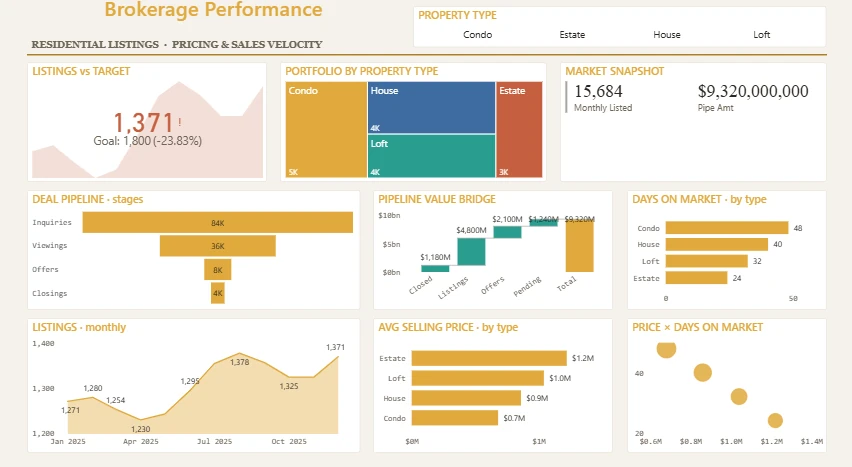
The Brokerage Performance dashboard turns day-to-day banking & finance data into a clear, decision-ready view. Built on a sleek, dark Power BI canvas, it brings the metrics that matter — Monthly Listed, Listed Target, Type Listed, Type Price, Type Days and Pipe Amount — together on a single interactive page so trends, outliers and progress against target are obvious at a glance.
🧱 Key Features:
✅ Monthly Listed
✅ Listed Target
✅ Type Listed
✅ Type Price
✅ Type Days
✅ Pipe Amount
✅ Ranked horizontal breakdown
✅ Headline KPI cards
✅ Interactive slicers & filters


