Description
🛍️ Cannabis Retail Performance Dashboard 💹
🪞 Theme: Phantom Lime · Power BI
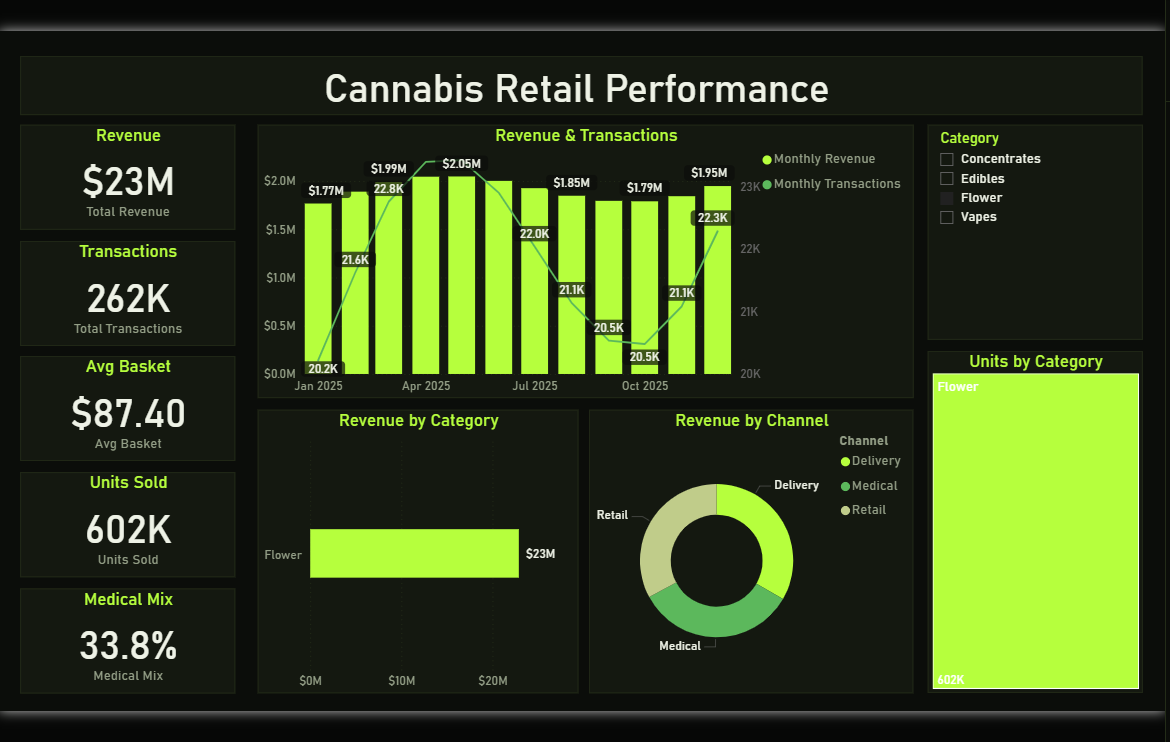
The Cannabis Retail Performance dashboard turns day-to-day retail & consumer data into a clear, decision-ready view. Built on a sleek, dark Power BI canvas, it brings the metrics that matter — Total Revenue, Total Transactions, Units Sold, Average Basket, Medical Mix and Monthly Revenue — together on a single interactive page so trends, outliers and progress against target are obvious at a glance.
🧱 Key Features:
✅ Total Revenue
✅ Total Transactions
✅ Units Sold
✅ Average Basket
✅ Medical Mix
✅ Monthly Revenue
✅ Monthly Transactions
✅ Headline KPI cards
✅ Interactive slicers & filters


