Description
🏦 Capital Markets Deal Pipeline Dashboard 🧾
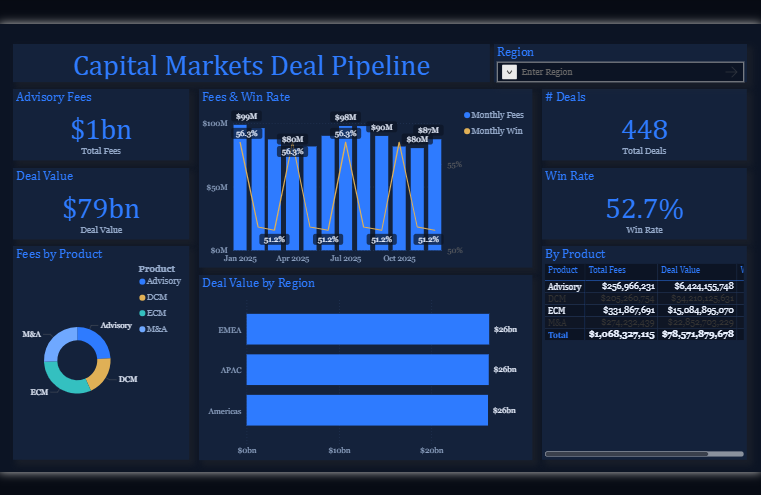
🌈 Theme: Nocturne Sapphire · Power BI
The Capital Markets Deal Pipeline dashboard turns day-to-day banking & finance data into a clear, decision-ready view. Built on a sleek, dark Power BI canvas, it brings the metrics that matter — Total Fees, Deal Value, Total Deals, Win Rate, Monthly Fees and Monthly Win — together on a single interactive page so trends, outliers and progress against target are obvious at a glance.
🔆 Key Features:
✅ Total Fees
✅ Deal Value
✅ Total Deals
✅ Win Rate
✅ Monthly Fees
✅ Monthly Win
✅ Product Fees
✅ Headline KPI cards
✅ Share-of-total donut breakdown


