Description
🏦 Capital Projects Portfolio Dashboard 🗄️
🪄 Theme: Dune Ochre · Power BI
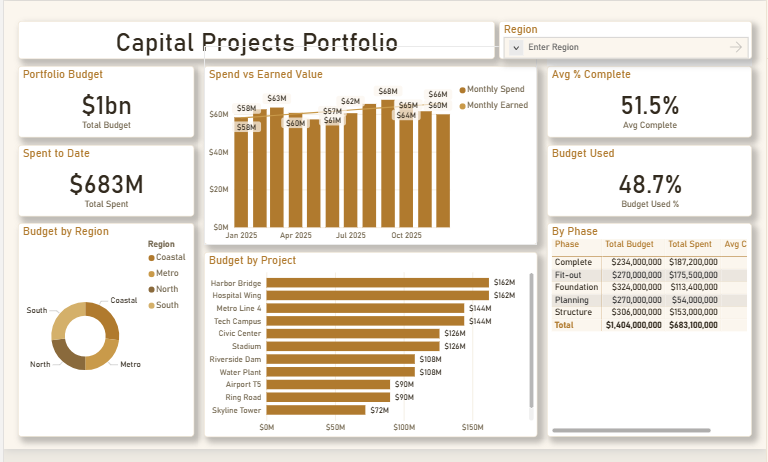
The Capital Projects Portfolio dashboard turns day-to-day banking & finance data into a clear, decision-ready view. Built on a clean, light Power BI canvas, it brings the metrics that matter — Total Budget, Total Spent, Average Complete, Budget Used %, Project Budget and Region Budget — together on a single interactive page so trends, outliers and progress against target are obvious at a glance.
🔧 Key Features:
✅ Total Budget
✅ Total Spent
✅ Average Complete
✅ Budget Used %
✅ Project Budget
✅ Region Budget
✅ Monthly Spend
✅ Headline KPI cards
✅ Share-of-total donut breakdown


