Description
🌍 Carbon & Climate Programme Dashboard 🔢
🎭 Theme: Carbon Mint · Power BI
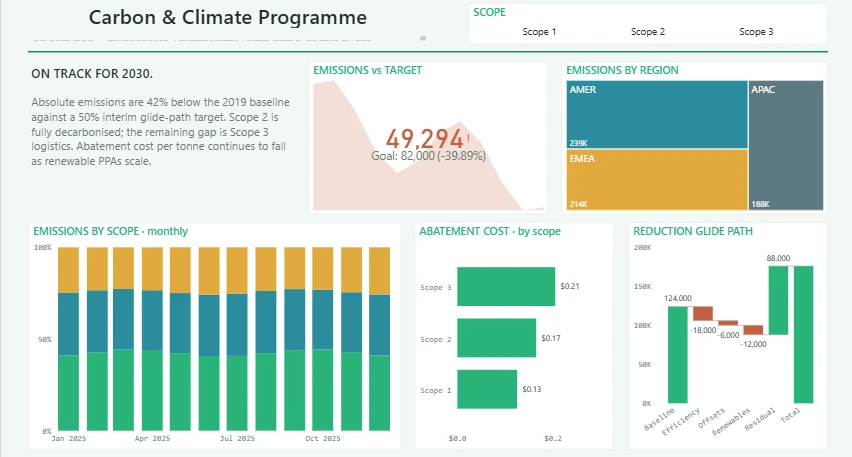
The Carbon & Climate Programme dashboard turns day-to-day sustainability & environment data into a clear, decision-ready view. Built on a sleek, dark Power BI canvas, it brings the metrics that matter — Monthly Emissions, Reduction Target, Scope Emissions, Scope Cost, Net Zero and Glide Target — together on a single interactive page so trends, outliers and progress against target are obvious at a glance.
🔑 Key Features:
✅ Monthly Emissions
✅ Reduction Target
✅ Scope Emissions
✅ Scope Cost
✅ Net Zero
✅ Glide Target
✅ Red Amount
✅ Headline KPI cards
✅ Interactive slicers & filters


