Description
🏭 Chemical Plant Operations Dashboard 🛰️
🪄 Theme: Toxic Bloom · Power BI
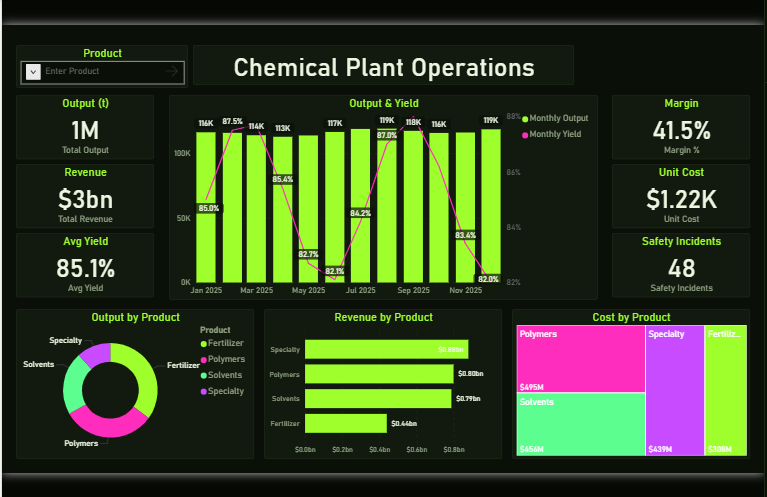
The Chemical Plant Operations dashboard turns day-to-day manufacturing & industrial data into a clear, decision-ready view. Built on a sleek, dark Power BI canvas, it brings the metrics that matter — Total Output, Total Revenue, Total Cost, Average Yield, Margin % and Unit Cost — together on a single interactive page so trends, outliers and progress against target are obvious at a glance.
🔧 Key Features:
✅ Total Output
✅ Total Revenue
✅ Total Cost
✅ Average Yield
✅ Margin %
✅ Unit Cost
✅ Safety Incidents
✅ Headline KPI cards
✅ Combo trend & volume chart


