Description
🚚 Container Port Operations Dashboard 🧠
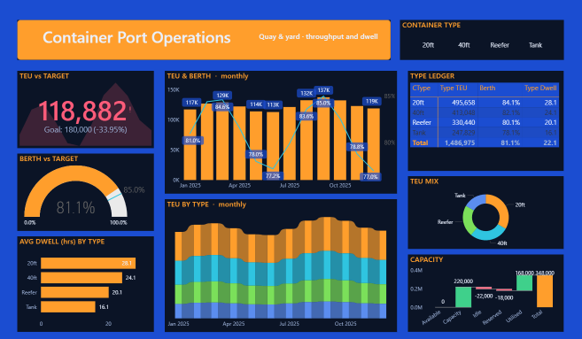
🧵 Theme: Quay Cobalt · Power BI
The Container Port Operations dashboard turns day-to-day logistics & supply chain data into a clear, decision-ready view. Built on a sleek, dark Power BI canvas, it brings the metrics that matter — Monthly Container Units, Type Container Units, Berth, Berth Target, Type Dwell and Container Units Target — together on a single interactive page so trends, outliers and progress against target are obvious at a glance.
📌 Key Features:
✅ Monthly Container Units
✅ Type Container Units
✅ Berth
✅ Berth Target
✅ Type Dwell
✅ Container Units Target
✅ Capacity Amount
✅ Headline KPI cards
✅ Goal-vs-actual gauge


