Description
🚚 Container Terminal Operations Dashboard 📉
🖌️ Theme: Tidal Cipher · Power BI
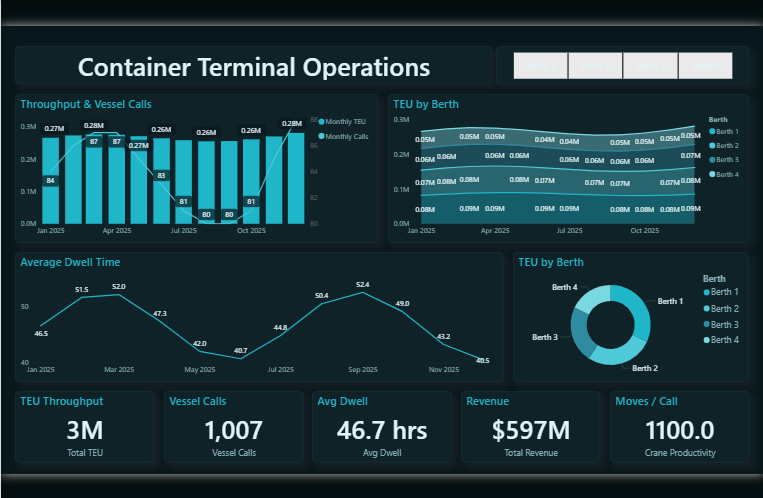
The Container Terminal Operations dashboard turns day-to-day logistics & supply chain data into a clear, decision-ready view. Built on a sleek, dark Power BI canvas, it brings the metrics that matter — Total Container Units, Vessel Calls, Average Dwell, Total Revenue, Crane Productivity and Monthly Container Units — together on a single interactive page so trends, outliers and progress against target are obvious at a glance.
🚀 Key Features:
✅ Total Container Units
✅ Vessel Calls
✅ Average Dwell
✅ Total Revenue
✅ Crane Productivity
✅ Monthly Container Units
✅ Monthly Calls
✅ Headline KPI cards
✅ Interactive slicers & filters


