Description
🏦 Corporate Financial Performance Dashboard 🗄️
🧪 Theme: Aurora Glaciem · Power BI
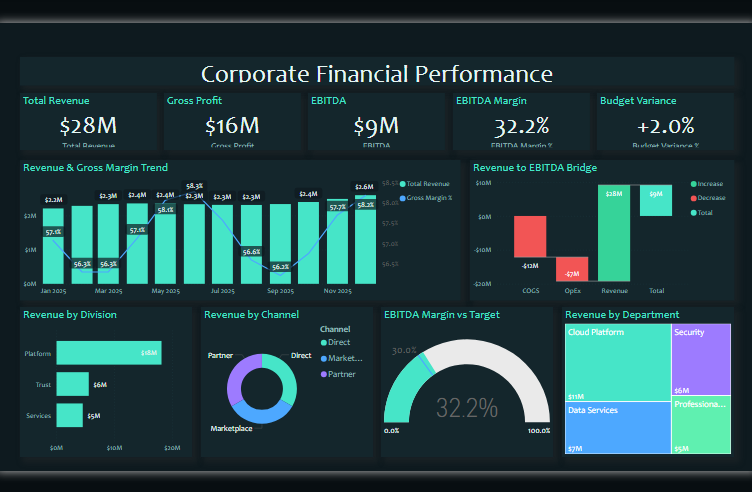
The Corporate Financial Performance dashboard turns day-to-day banking & finance data into a clear, decision-ready view. Built on a sleek, dark Power BI canvas, it brings the metrics that matter — Total Revenue, Total Cost of Goods Sold, Gross Profit, Gross Margin %, Total Op Ex and EBITDA — together on a single interactive page so trends, outliers and progress against target are obvious at a glance.
🌟 Key Features:
✅ Total Revenue
✅ Total Cost of Goods Sold
✅ Gross Profit
✅ Gross Margin %
✅ Total Op Ex
✅ EBITDA
✅ EBITDA Margin %
✅ Headline KPI cards
✅ Interactive slicers & filters


