Description
🛍️ Craft Brewery Performance Dashboard 🧾
🌈 Theme: Seafoam Linen · Power BI
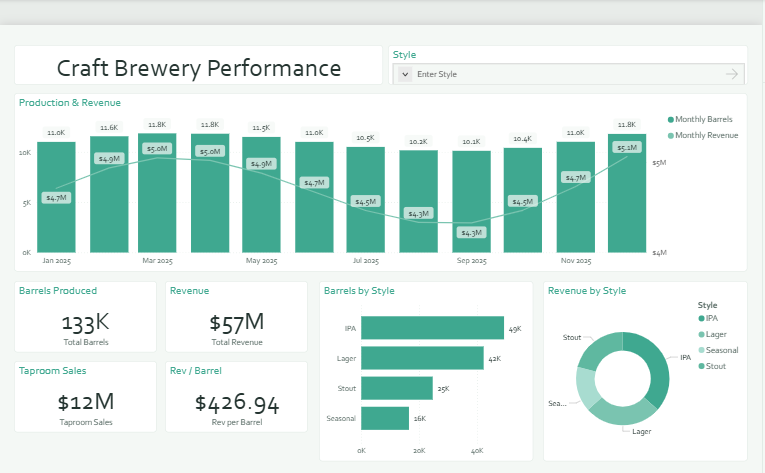
The Craft Brewery Performance dashboard turns day-to-day retail & consumer data into a clear, decision-ready view. Built on a clean, light Power BI canvas, it brings the metrics that matter — Total Barrels, Total Revenue, Taproom Sales, Revenue per Barrel, Monthly Barrels and Monthly Revenue — together on a single interactive page so trends, outliers and progress against target are obvious at a glance.
💡 Key Features:
✅ Total Barrels
✅ Total Revenue
✅ Taproom Sales
✅ Revenue per Barrel
✅ Monthly Barrels
✅ Monthly Revenue
✅ Style Barrels
✅ Headline KPI cards
✅ Combo trend & volume chart


