Description
💻 Data Center Operations Dashboard 🧮
🧪 Theme: Quartz Meridian · Power BI
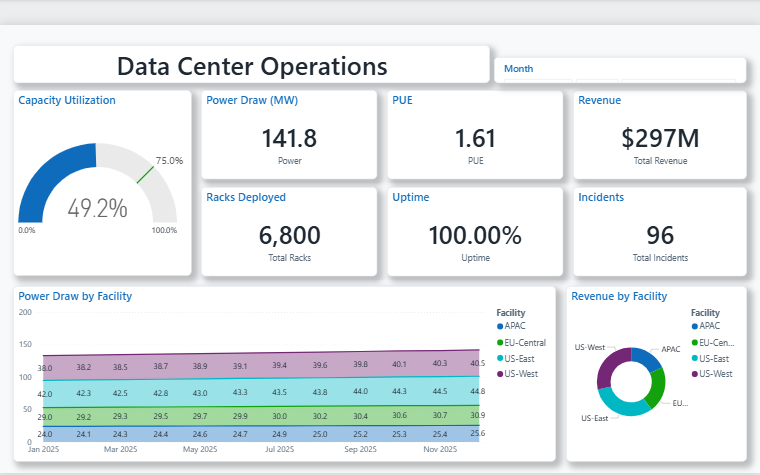
The Data Center Operations dashboard turns day-to-day technology & saas data into a clear, decision-ready view. Built on a clean, light Power BI canvas, it brings the metrics that matter — Power, IT Load, Power Usage Effectiveness, Total Capacity, Utilization and Utilisation Target — together on a single interactive page so trends, outliers and progress against target are obvious at a glance.
⭐ Key Features:
✅ Power
✅ IT Load
✅ Power Usage Effectiveness
✅ Total Capacity
✅ Utilization
✅ Utilisation Target
✅ Total Racks
✅ Headline KPI cards
✅ Goal-vs-actual gauge


