Description
⚡ ESG & Renewable Energy Scorecard Dashboard 🧮
🪄 Theme: Linen Sage · Power BI
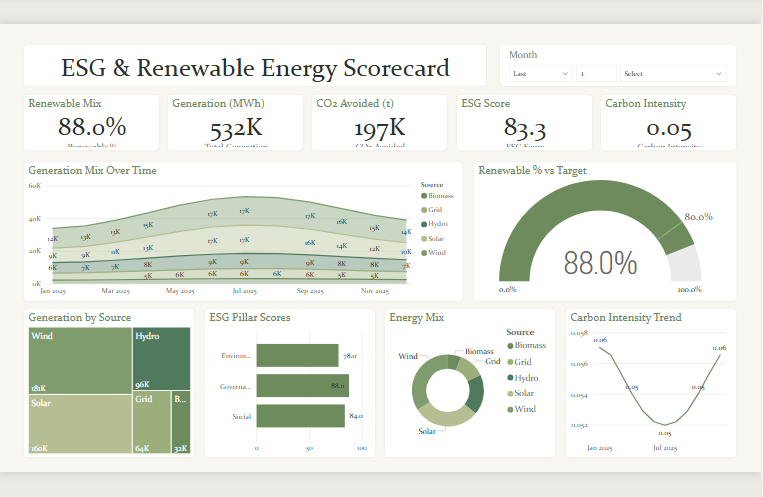
The ESG & Renewable Energy Scorecard dashboard turns day-to-day energy & utilities data into a clear, decision-ready view. Built on a clean, light Power BI canvas, it brings the metrics that matter — Total Generation, Renewable Megawatt-hours, Renewable %, CO₂ Avoided, Carbon Intensity and Renewable Target — together on a single interactive page so trends, outliers and progress against target are obvious at a glance.
🎛️ Key Features:
✅ Total Generation
✅ Renewable Megawatt-hours
✅ Renewable %
✅ CO₂ Avoided
✅ Carbon Intensity
✅ Renewable Target
✅ ESG Score
✅ Headline KPI cards
✅ Interactive slicers & filters


