Description
🏦 Exchange Trading Desk Dashboard 🧮
🧪 Theme: Crypto Lapis · Power BI
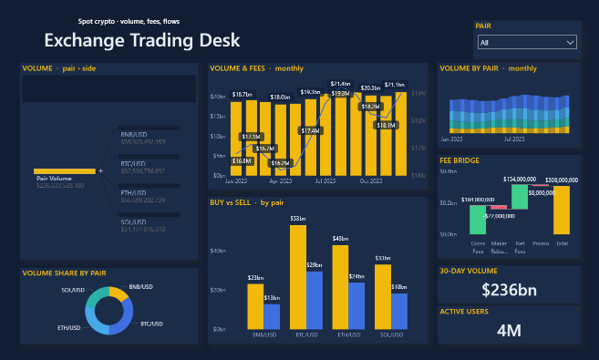
The Exchange Trading Desk dashboard turns day-to-day banking & finance data into a clear, decision-ready view. Built on a sleek, dark Power BI canvas, it brings the metrics that matter — Total Volume, Monthly Volume, Pair Volume, Pair Fees, Monthly Active Users and Monthly Active Users Target — together on a single interactive page so trends, outliers and progress against target are obvious at a glance.
⭐ Key Features:
✅ Total Volume
✅ Monthly Volume
✅ Pair Volume
✅ Pair Fees
✅ Monthly Active Users
✅ Monthly Active Users Target
✅ Active Users
✅ Headline KPI cards
✅ Interactive slicers & filters


