Description
🧬 Genomic R&D Pipeline Dashboard 🛰️
🧪 Theme: Coral Lab · Power BI
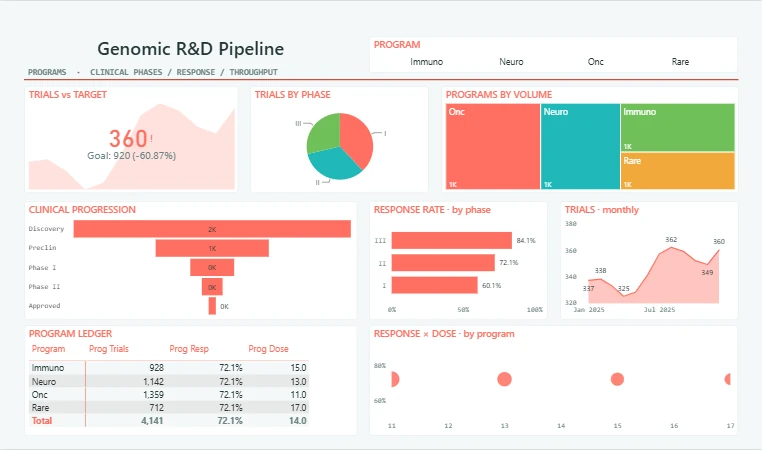
The Genomic R&D Pipeline dashboard turns day-to-day pharma & life sciences data into a clear, decision-ready view. Built on a sleek, dark Power BI canvas, it brings the metrics that matter — Total Trials, Trial Target, Programme Trials, Programme Response and Programme Dose — together on a single interactive page so trends, outliers and progress against target are obvious at a glance.
⭐ Key Features:
✅ Total Trials
✅ Trial Target
✅ Programme Trials
✅ Programme Response
✅ Programme Dose
✅ Headline KPI cards
✅ Interactive slicers & filters
✅ KPI status indicator
✅ Proportional pie breakdown