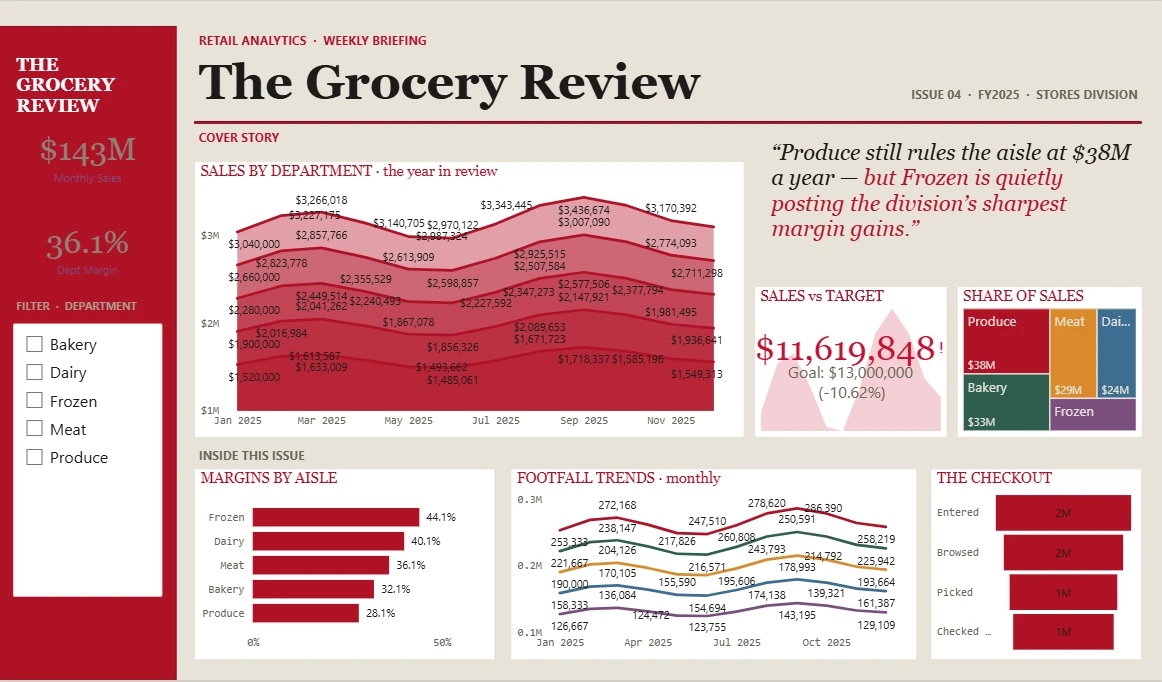
Description
🛍️ Grocery Retail Performance Dashboard 📊
🎨 Theme: Apron Slate · Power BI
The Grocery Retail Performance dashboard turns day-to-day retail & consumer data into a clear, decision-ready view. Built on a sleek, dark Power BI canvas, it brings the metrics that matter — Monthly Sales, Sales Target, Department Sales, Department Footfall and Department Margin — together on a single interactive page so trends, outliers and progress against target are obvious at a glance.
✨ Key Features:
✅ Monthly Sales
✅ Sales Target
✅ Department Sales
✅ Department Footfall
✅ Department Margin
✅ Headline KPI cards
✅ Conversion funnel
✅ Cumulative area trends
✅ Interactive slicers & filters


