Description
🧭 Law Firm Performance Dashboard 🛰️
🧪 Theme: Marble Lumen · Power BI
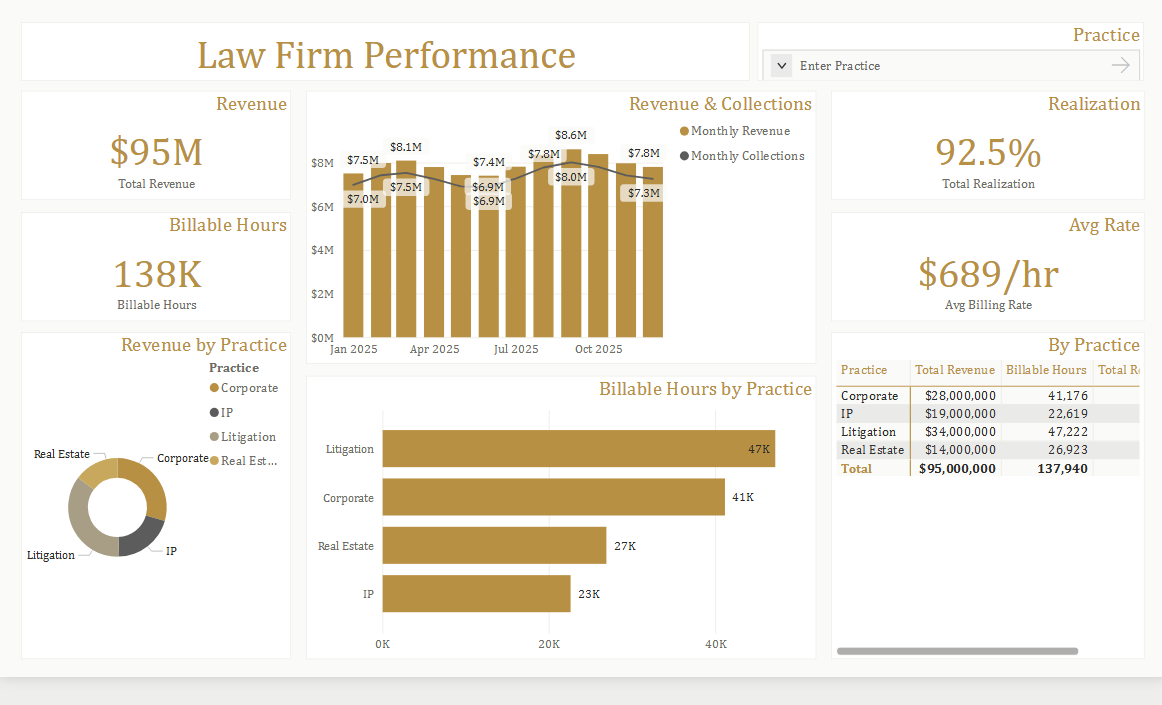
The Law Firm Performance dashboard turns day-to-day professional services data into a clear, decision-ready view. Built on a clean, light Power BI canvas, it brings the metrics that matter — Total Revenue, Billable Hours, Total Realization, Average Billing Rate, Practice Revenue and Practice Hours — together on a single interactive page so trends, outliers and progress against target are obvious at a glance.
🌟 Key Features:
✅ Total Revenue
✅ Billable Hours
✅ Total Realization
✅ Average Billing Rate
✅ Practice Revenue
✅ Practice Hours
✅ Monthly Revenue
✅ Headline KPI cards
✅ Share-of-total donut breakdown