Description
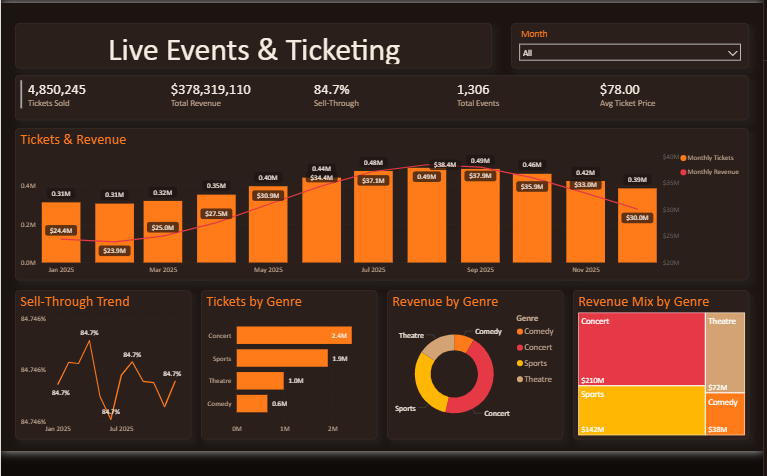
🎬 Live Events & Ticketing Dashboard 💹
🪞 Theme: Ember Stratum · Power BI
The Live Events & Ticketing dashboard turns day-to-day media & entertainment data into a clear, decision-ready view. Built on a sleek, dark Power BI canvas, it brings the metrics that matter — Tickets Sold, Total Revenue, Sell-Through, Total Events, Average Ticket Price and Monthly Tickets — together on a single interactive page so trends, outliers and progress against target are obvious at a glance.
🧭 Key Features:
✅ Tickets Sold
✅ Total Revenue
✅ Sell-Through
✅ Total Events
✅ Average Ticket Price
✅ Monthly Tickets
✅ Monthly Revenue
✅ Headline KPI cards
✅ Interactive slicers & filters