Description
🏦 Luxury Real Estate Brokerage Dashboard 🗄️
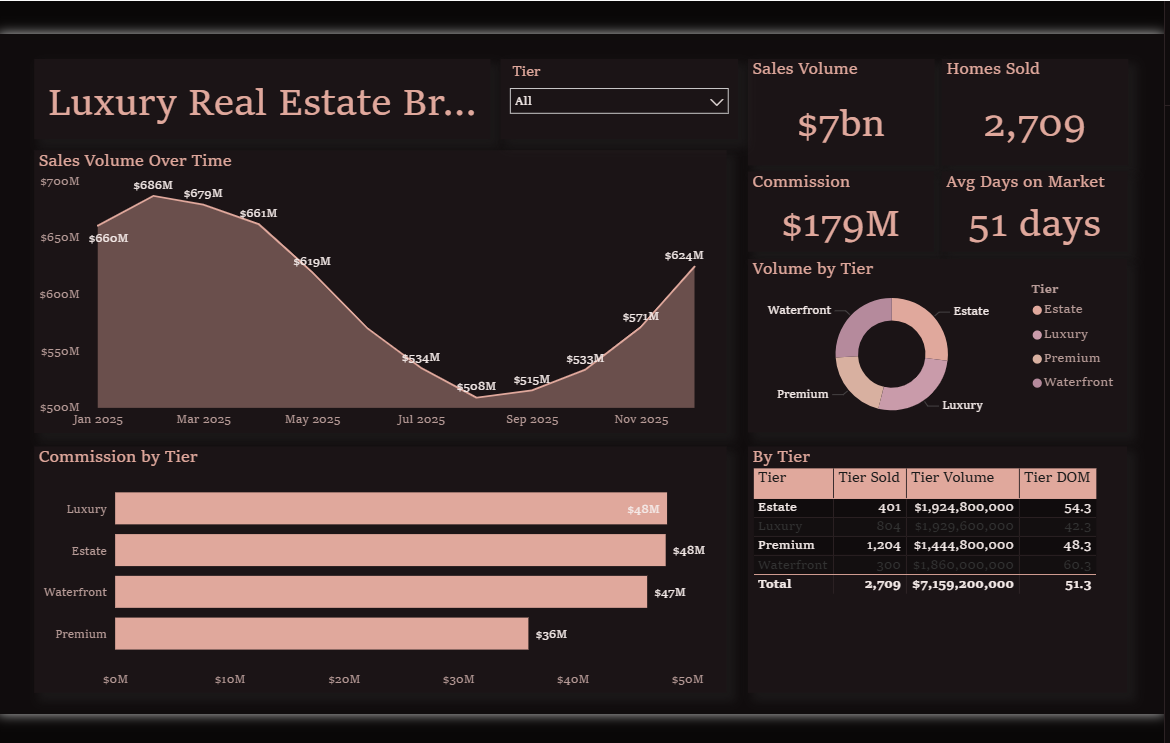
🪄 Theme: Onyx Rose Gold · Power BI
The Luxury Real Estate Brokerage dashboard turns day-to-day banking & finance data into a clear, decision-ready view. Built on a sleek, dark Power BI canvas, it brings the metrics that matter — Sales Volume, Homes Sold, Total Commission, Average Days on Market, Monthly Volume and Tier Volume — together on a single interactive page so trends, outliers and progress against target are obvious at a glance.
🎛️ Key Features:
✅ Sales Volume
✅ Homes Sold
✅ Total Commission
✅ Average Days on Market
✅ Monthly Volume
✅ Tier Volume
✅ Tier Commission
✅ Headline KPI cards
✅ Interactive slicers & filters


