Description
🏢 Maison Performance Dashboard 🗄️
🪄 Theme: Wax Onyx · Power BI
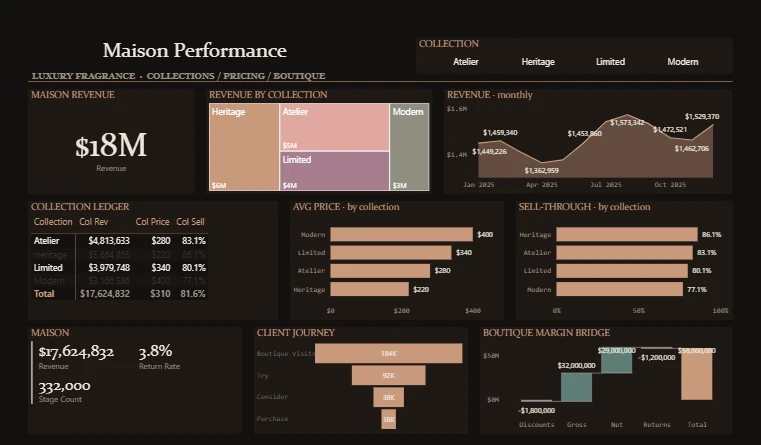
The Maison Performance dashboard turns day-to-day real estate data into a clear, decision-ready view. Built on a sleek, dark Power BI canvas, it brings the metrics that matter — Revenue, Monthly Revenue, Collection Revenue, Collection Price, Collection Sell-Through and Return Rate — together on a single interactive page so trends, outliers and progress against target are obvious at a glance.
🔧 Key Features:
✅ Revenue
✅ Monthly Revenue
✅ Collection Revenue
✅ Collection Price
✅ Collection Sell-Through
✅ Return Rate
✅ Retention Target
✅ Headline KPI cards
✅ Ranked horizontal breakdown