Description
🧬 Pharmacy Chain Performance Dashboard 🔢
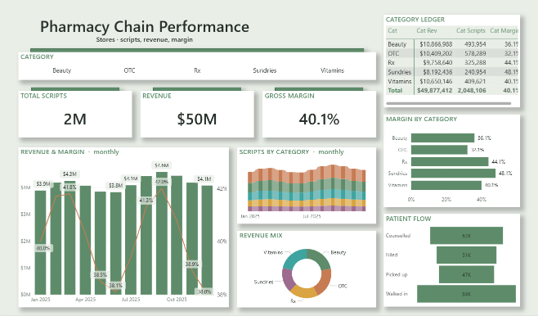
🪟 Theme: Sage Pharma · Power BI
The Pharmacy Chain Performance dashboard turns day-to-day pharma & life sciences data into a clear, decision-ready view. Built on a clean, light Power BI canvas, it brings the metrics that matter — Total Scripts, Revenue, Gross Margin, Monthly Revenue, Monthly Margin and Category Revenue — together on a single interactive page so trends, outliers and progress against target are obvious at a glance.
🧩 Key Features:
✅ Total Scripts
✅ Revenue
✅ Gross Margin
✅ Monthly Revenue
✅ Monthly Margin
✅ Category Revenue
✅ Category Scripts
✅ Headline KPI cards
✅ Interactive slicers & filters


