Description
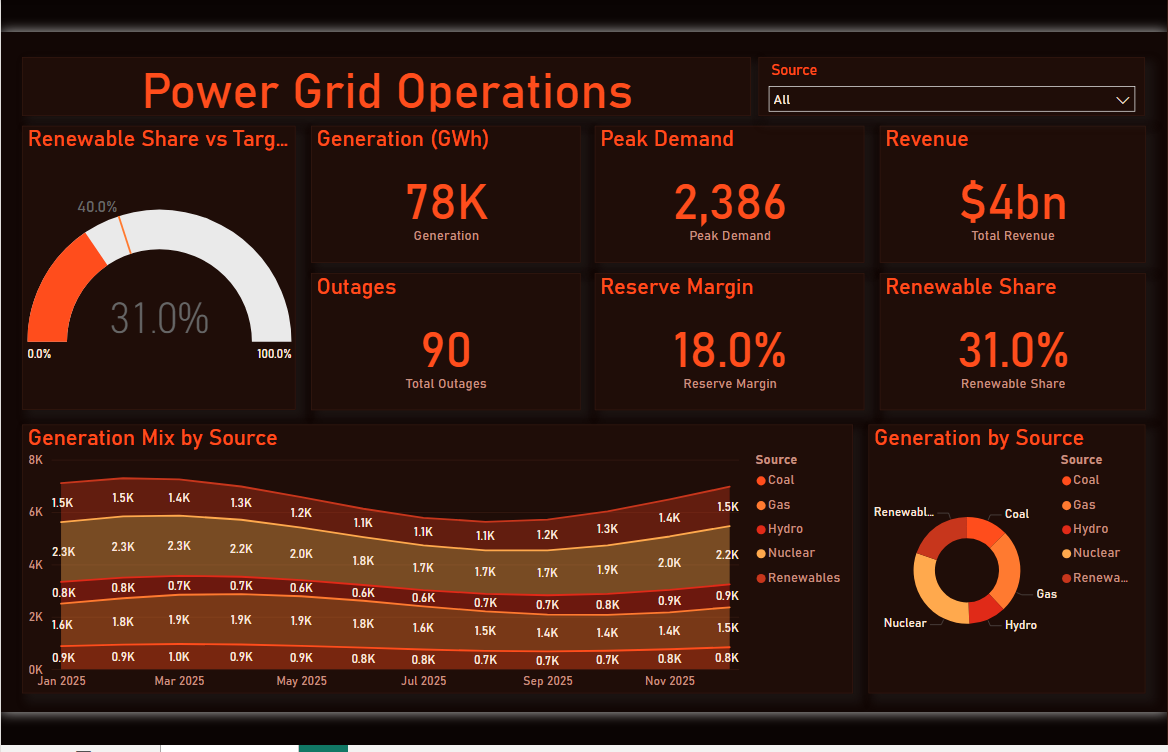
⚡ Power Grid Operations Dashboard 📉
🎚️ Theme: Magma Core · Power BI
The Power Grid Operations dashboard turns day-to-day energy & utilities data into a clear, decision-ready view. Built on a sleek, dark Power BI canvas, it brings the metrics that matter — Generation, Peak Demand, Renewable Share, Renewable Target, Total Revenue and Total Outages — together on a single interactive page so trends, outliers and progress against target are obvious at a glance.
⚡ Key Features:
✅ Generation
✅ Peak Demand
✅ Renewable Share
✅ Renewable Target
✅ Total Revenue
✅ Total Outages
✅ Reserve Margin
✅ Headline KPI cards
✅ Interactive slicers & filters