Description
🏦 Private Equity Dashboard 🛰️
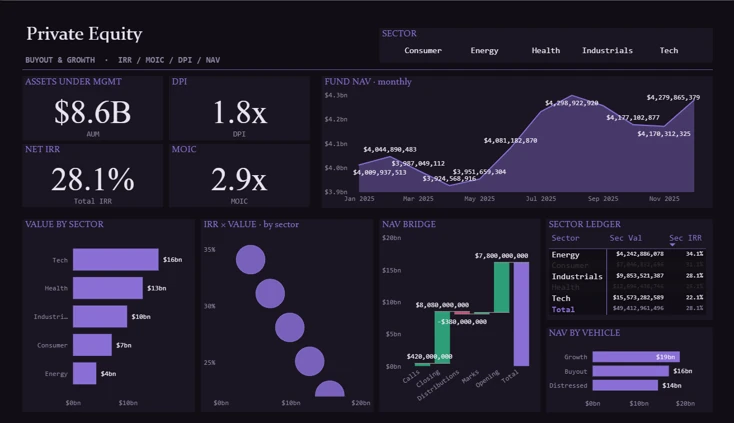
🪄 Theme: Velvet Onyx · Power BI
The Private Equity dashboard turns day-to-day banking & finance data into a clear, decision-ready view. Built on a sleek, dark Power BI canvas, it brings the metrics that matter — Assets under Management, Total Internal Rate of Return, Distributions to Paid-In, Multiple on Invested Capital, Monthly Value and Value Target — together on a single interactive page so trends, outliers and progress against target are obvious at a glance.
🎛️ Key Features:
✅ Assets under Management
✅ Total Internal Rate of Return
✅ Distributions to Paid-In
✅ Multiple on Invested Capital
✅ Monthly Value
✅ Value Target
✅ Sector Value
✅ Headline KPI cards
✅ Interactive slicers & filters


