Description
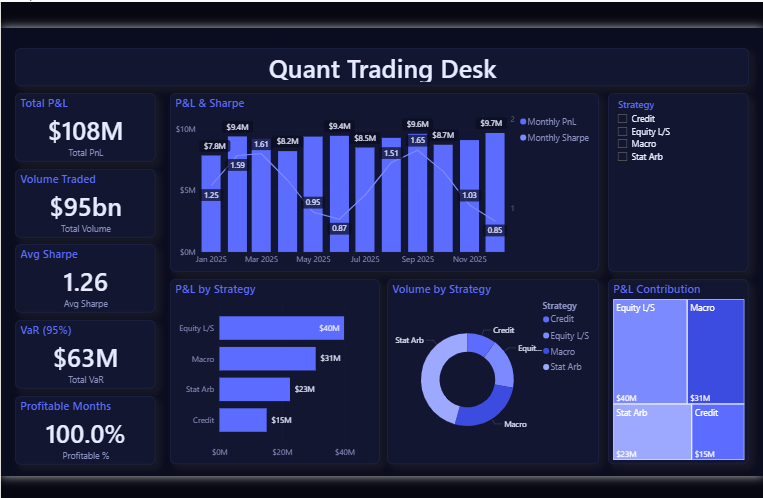
🏦 Quant Trading Desk Dashboard 📈
🎭 Theme: Vortex Indigo · Power BI
The Quant Trading Desk dashboard turns day-to-day banking & finance data into a clear, decision-ready view. Built on a sleek, dark Power BI canvas, it brings the metrics that matter — Total Profit & Loss, Total Volume, Average Sharpe, Total Value at Risk, Profitable % and Monthly Profit & Loss — together on a single interactive page so trends, outliers and progress against target are obvious at a glance.
🏆 Key Features:
✅ Total Profit & Loss
✅ Total Volume
✅ Average Sharpe
✅ Total Value at Risk
✅ Profitable %
✅ Monthly Profit & Loss
✅ Monthly Sharpe
✅ Headline KPI cards
✅ Interactive slicers & filters