Description
💧 Recycling & Recovery Dashboard 💹
🪞 Theme: Verde Cycle · Power BI
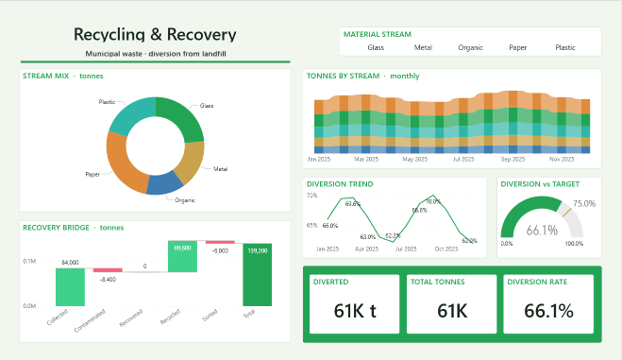
The Recycling & Recovery dashboard turns day-to-day utilities data into a clear, decision-ready view. Built on a clean, light Power BI canvas, it brings the metrics that matter — Diverted, Monthly Tonnes, Stream Tonnes, Diversion, Dividend Target and Stream Dividend — together on a single interactive page so trends, outliers and progress against target are obvious at a glance.
🧱 Key Features:
✅ Diverted
✅ Monthly Tonnes
✅ Stream Tonnes
✅ Diversion
✅ Dividend Target
✅ Stream Dividend
✅ Flow Amount
✅ Headline KPI cards
✅ Share-of-total donut breakdown