Description
⚡ Residential Solar Installer Dashboard 🧾
🪞 Theme: Solaris Bloom · Power BI
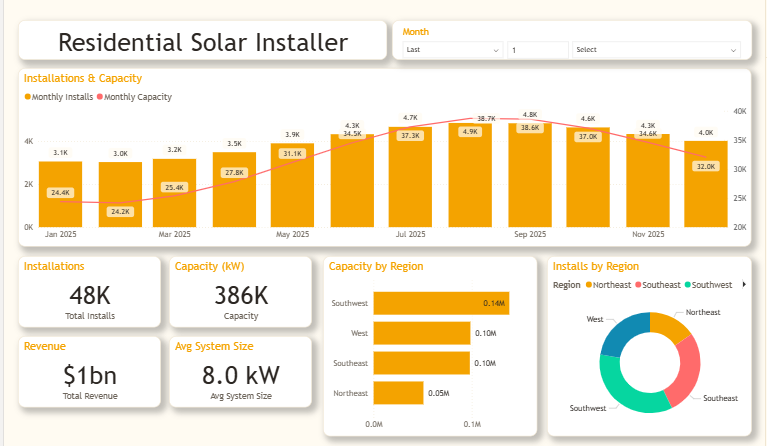
The Residential Solar Installer dashboard turns day-to-day energy & utilities data into a clear, decision-ready view. Built on a clean, light Power BI canvas, it brings the metrics that matter — Total Installs, Capacity, Total Revenue, Average System Size, Monthly Installs and Monthly Capacity — together on a single interactive page so trends, outliers and progress against target are obvious at a glance.
🧱 Key Features:
✅ Total Installs
✅ Capacity
✅ Total Revenue
✅ Average System Size
✅ Monthly Installs
✅ Monthly Capacity
✅ Region Capacity
✅ Headline KPI cards
✅ Interactive slicers & filters


