Description
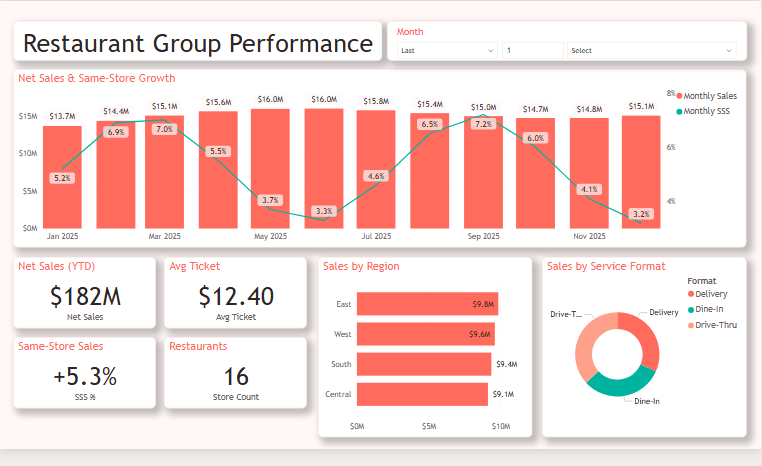
🛍️ Restaurant Group Performance Dashboard 📊
🧵 Theme: Coral Reef Light · Power BI
The Restaurant Group Performance dashboard turns day-to-day retail & consumer data into a clear, decision-ready view. Built on a clean, light Power BI canvas, it brings the metrics that matter — Net Sales, Total Transactions, Average Ticket, Same-Store Sales %, Average Unit Volume and Store Count — together on a single interactive page so trends, outliers and progress against target are obvious at a glance.
📌 Key Features:
✅ Net Sales
✅ Total Transactions
✅ Average Ticket
✅ Same-Store Sales %
✅ Average Unit Volume
✅ Store Count
✅ Monthly Sales
✅ Headline KPI cards
✅ Interactive slicers & filters


