Description
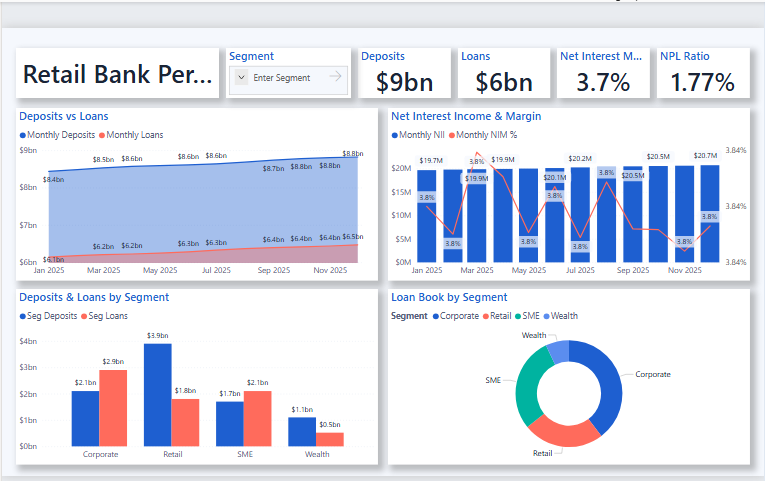
🏦 Retail Bank Performance Dashboard 💹
🌈 Theme: Cobalt Bloom · Power BI
The Retail Bank Performance dashboard turns day-to-day banking & finance data into a clear, decision-ready view. Built on a clean, light Power BI canvas, it brings the metrics that matter — Total Deposits, Total Loans, Net Interest Margin %, Monthly Net Interest Margin %, Non-Performing Loans Ratio and Monthly Deposits — together on a single interactive page so trends, outliers and progress against target are obvious at a glance.
💡 Key Features:
✅ Total Deposits
✅ Total Loans
✅ Net Interest Margin %
✅ Monthly Net Interest Margin %
✅ Non-Performing Loans Ratio
✅ Monthly Deposits
✅ Monthly Loans
✅ Headline KPI cards
✅ Cumulative area trends


