Description
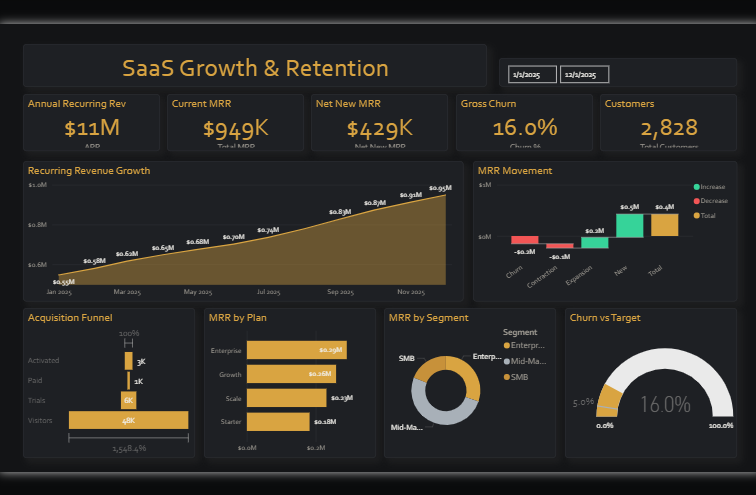
💻 SaaS ARR & Churn Performance Dashboard 🖼️
🪟 Theme: Carbon Lumen · Power BI
The SaaS ARR & Churn Performance dashboard turns day-to-day technology & saas data into a clear, decision-ready view. Built on a sleek, dark Power BI canvas, it brings the metrics that matter — Total Monthly Recurring Revenue, Annual Recurring Revenue, Ending Monthly Recurring Revenue, Gross New Monthly Recurring Revenue, Lost Monthly Recurring Revenue and Net New Monthly Recurring Revenue — together on a single interactive page so trends, outliers and progress against target are obvious at a glance.
📋 Key Features:
✅ Total Monthly Recurring Revenue
✅ Annual Recurring Revenue
✅ Ending Monthly Recurring Revenue
✅ Gross New Monthly Recurring Revenue
✅ Lost Monthly Recurring Revenue
✅ Net New Monthly Recurring Revenue
✅ Churn %
✅ Headline KPI cards
✅ Interactive slicers & filters


