Description
🛡️ Security Operations Center Dashboard 🧠
🎨 Theme: Graphite Pulse · Power BI
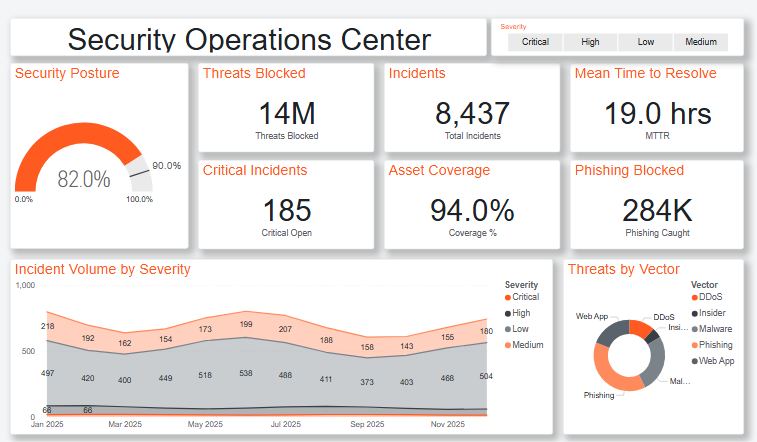
The Security Operations Center dashboard turns day-to-day security & cyber data into a clear, decision-ready view. Built on a clean, light Power BI canvas, it brings the metrics that matter — Threats Blocked, Total Incidents, Mean Time to Repair, Critical Open, Coverage % and Phishing Caught — together on a single interactive page so trends, outliers and progress against target are obvious at a glance.
📐 Key Features:
✅ Threats Blocked
✅ Total Incidents
✅ Mean Time to Repair
✅ Critical Open
✅ Coverage %
✅ Phishing Caught
✅ Posture Score
✅ Headline KPI cards
✅ Interactive slicers & filters


