Description
🏗️ Construction Programme Dashboard 🛰️
🪄 Theme: Site Lumber · Power BI
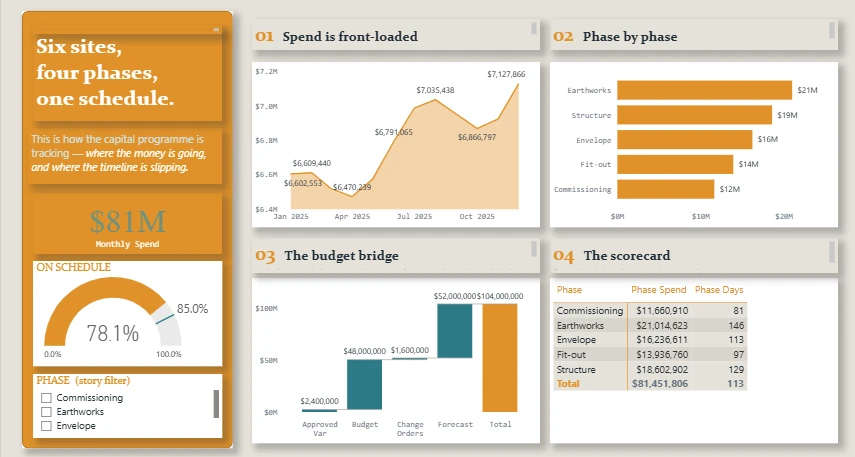
The Construction Programme dashboard turns day-to-day construction & engineering data into a clear, decision-ready view. Built on a sleek, dark Power BI canvas, it brings the metrics that matter — Monthly Spend, Scheduled Target, Schedule, Phase Spend, Phase Days and On-Schedule Target — together on a single interactive page so trends, outliers and progress against target are obvious at a glance.
🔧 Key Features:
✅ Monthly Spend
✅ Scheduled Target
✅ Schedule
✅ Phase Spend
✅ Phase Days
✅ On-Schedule Target
✅ Budget Amount
✅ Headline KPI cards
✅ Goal-vs-actual gauge


