Description
✈️ Smart City Traffic Dashboard 📉
🖌️ Theme: Signal Asphalt · Power BI
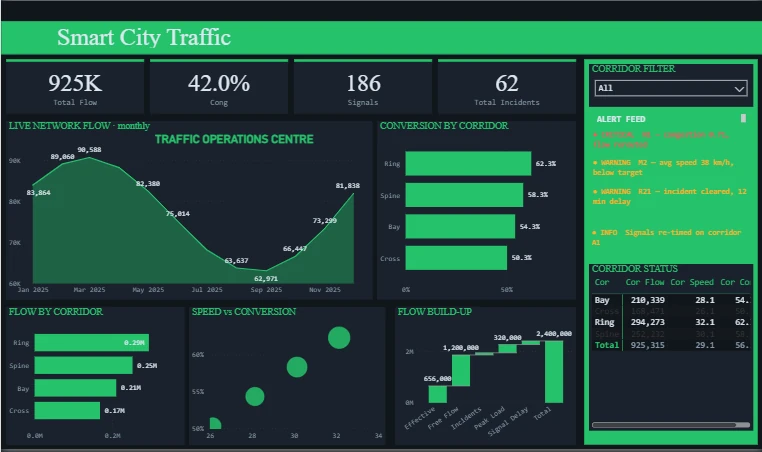
The Smart City Traffic dashboard turns day-to-day transport & mobility data into a clear, decision-ready view. Built on a sleek, dark Power BI canvas, it brings the metrics that matter — Total Flow, Congestion, Signals, Total Incidents, Monthly Flow and Corridor Flow — together on a single interactive page so trends, outliers and progress against target are obvious at a glance.
🚀 Key Features:
✅ Total Flow
✅ Congestion
✅ Signals
✅ Total Incidents
✅ Monthly Flow
✅ Corridor Flow
✅ Corridor Speed
✅ Headline KPI cards
✅ Ranked horizontal breakdown


